


Summary
With the emphasis on lightweighting, composites are being turned to help reduce weight while still maintaining strength and stiffness. However, composites tend to be linear elastic to failure, so there is often no warning of failure (unlike in metallic components). For this research, a pipe section was fabricated from an Inconel 718 liner with a carbon composite overwrap. The pipe was then subjected to increasing internal pressure until failure. The results from this experiment were used to assist in creating and validating a finite-element model of the experiment. The model uses advanced numerical techniques to predict when failure will occur. This article will present the fabrication, testing, and modeling of this effort.
Introduction
Research into using composites for high-pressure and high-temperature applications has been conducted before [1], but full maturity has not yet been reached. Advances in modeling, testing, and validation are still required before this technology can be fully implemented. One of the issues is that composites can undergo microdamage, leading to variations of the mechanical properties. The microdamage can be the result of high internal pressures and/or exposure to physical trauma. Modeling techniques, such as homogenization, are effective outside these critical regions. However, they break down in regions where the microdamage occurs. In order to account for cracking, the mesh would need to follow the crack, resulting in remeshing and a high computational cost. To address this issue, the extended finite-element method (XFEM) [2] was developed and has demonstrated a significant advantage over other approaches, such as boundary element methods [3] and remeshing [4]. In XFEM, the finite-element space is enriched with a discontinuous function and near-tip asymptotic functions through the framework of unity partition [5].
A composite tube was made from a candidate high-temperature composite and subjected to a burst test. An initial basic model based on classical laminated plate theory was developed to predict when failure would occur. The results from this experiment were used to assist in creating and validating a finite-element model of the experiment. The model uses XFEM techniques to predict when failure will occur. This article will cover the design, fabrication, burst testing, and modeling of the candidate composite tube.
High-Temperature Composite Tube
All recent efforts by Benét Laboratories in composite gun tubes have focused on tank cannons [6]. In that application, the composite is a prestressed jacket over only part of the gun tube, and the temperatures in the composite are significantly lower than in other applications. The materials and fabrication methods used for tank cannons do not directly apply to every situation, as thinner walls cannot support a substantial prestress and the materials themselves cannot handle the operating temperatures seen in every application. Other work at Benét [7, 8] looked at using ceramic liners surrounded by a polymer composite. The need for both hoop and axial prestress coupled with the inherent brittleness of the ceramics made this approach unfeasible.
Material options—high-temperature and high-pressure applications—are carbon/carbon, geopolymer composites, and metal matrix composites (MMC). Both the geopolymer and MMC options needed a thermal barrier coating (TBC) layer to reduce the heat getting into the structural layer and a metallic superalloy liner to act as a gas seal and sliding surface for the round. This concept of a liner, TBC, and structural composite was then patented [9].
For the current effort, the TBC layers were omitted, as this was a structural test and elevated temperatures were not part of the test. This reduced both the cost and manufacturing complexity.
Tube Fabrication
Under a Foreign Technology (and Science) Assessment Support program, a composite tube was fabricated at Pyromeral Systems in Barbery, France. (They use their PyroSiC and PyroKarb formulations in a variety of different high-temperature applications, such as Formula 1 exhaust ducts [10].) We selected the PyroKarb resin with IM7 carbon fiber as the reinforcement. The tube was filament wound over an Inconel 718 liner using a wet winding process and cured in an oven. It was then postcured under nitrogen at 704 °C (1300 °F). Figure 1 shows the composite tube being fabricated, and Figure 2 shows it after fabrication.
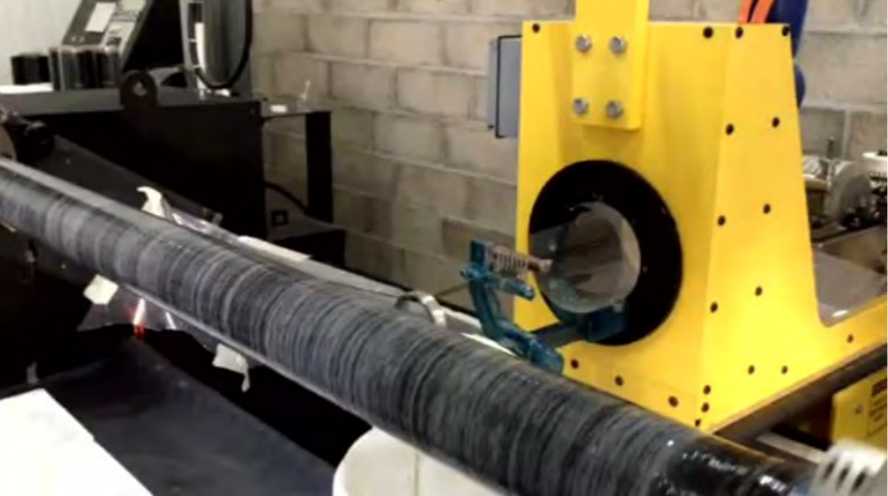
Figure 1: Winding the Composite Tube (Source: U.S. Army Combat Capabilities Development Command Armaments Center [CCDC AC]).
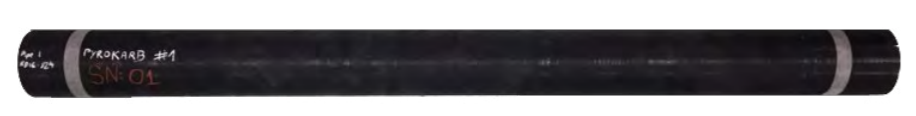
Figure 2: PyroKarb Composite Tube (Source: CCDC AC).
Originally, the tube was intended for a firing test inside a larger steel tube, so it was required to have a specific inner and outer diameters. This and the limitations of filament winding determined the specific composite layup. The layup selected was [90 2, (±60, 90 4)5, ±60, 90 2] T. The 90-degree plies are cylindrical windings, with each winding circuit being a single coverage in one direction. Thus, a single down and back pass on the winder creates two hoop plies. The ±60-degree layers are helical windings, with each winding layer creating an interwoven double-thickness layer.
Initial Modeling
As a starting point, Autodesk Helius Composite 2017 (hereto referred as Helius) was used to model the layup. Each layer was treated as a unidirectional layer in Helius. The individual layer thickness was determined by physically measuring the tube and its Inconel liner. The composite thickness was divided by 36 to give the average per layer thickness for the model. This resulted in a thickness of 0.686 mm (0.027 in) for the Inconel liner and 0.107 mm (0.004 in) for the composite layers. Exact material properties were not known for the PyroKarb/IM7 material, so IM7/977-2 was used as an analog in Helius. This would provide an overestimation of the tube’s performance but was expected to be in the right ballpark.
Helius used classical laminated plate theory to generate the layup properties and outputs of those properties, as well as the ABD matrix (which relates cross-sectional forces and moments to mid-plane strains and curvatures), which can then be fed into Abaqus for a higher fidelity analysis. The tube/beam analysis option was used in Helius to get an idea of when the tube would fail. The tube’s average measured internal radius of 40.44 mm (1.592 in) was used, and the pressure was increased until first-ply failure was observed based on a maximum stress criterion. Failure was observed at 103 MPa (15 ksi). Helius predicted that the Inconel liner and the first layer would fail at this pressure. The predicted strain at failure can be seen in Figure 3.
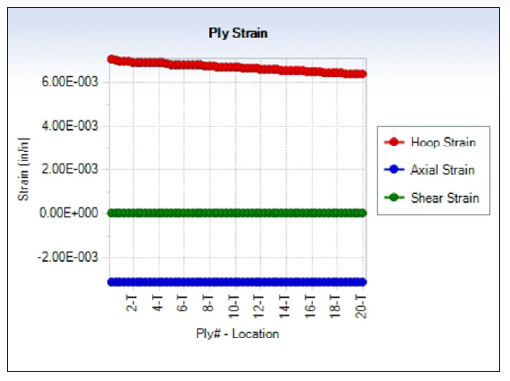
Figure 3: Strain by Layer at Failure (Source: CCDC AC).
Burst Test
Initial Modeling
The 1.139-m (44.875-in)-long test specimen, with a smooth Inconel bore surface measuring a nominal 80.5 mm (3.170 in), was provided to the Tube Fatigue Laboratory, Benét Laboratories, Watervliet, NY. The evaluated test specimen had a nominal outer diameter of 90.5 mm (3.563 in) and a nominal wall thickness of 4.4 mm (0.174 in). Four rosette strain gages were placed 90 degrees apart from each other on the exterior surface of the test specimen, centered about its overall length. The gages were Micro-Measurements CEA-06-250UR-350 gages, with grid 3 in the hoop direction.
The entire test fixture assembly was placed on top of riser blocks inside the 3-million-pound press. This test assembly utilized enclosures on the top and bottom of the specimen, with a rubber O-ring and a metal seal in each sealing pocket of the enclosures. The load frame prevents the sealing assemblies and enclosures from exiting the test specimen during pressurization. The combination of the O-ring and metal seal allows sealing between low and high pressures. The O-ring provides low-pressure sealing, as well as the force necessary to drive the metal seal against the enclosure and, in turn, against the sealing pocket of the test specimen. A well-machined surface finish on the metal seal interfaces allows high-pressure sealing. Figure 4 shows the tube in the hydraulic press and a close-up of the strain gage wiring.

Figure 4: Tube in the Hydraulic Press (Left) and Close-up of Strain Gage Location (Right) (Source: CCDC AC).
Burst Test
The pressure was ramped up until the specimen was no longer able to hold pressure. There were two audible indications of failure during the test. The first noise was the composite failing just above the midsection, and the second was failure of the liner and composite above it. Upon reviewing the data, it was found that the 12:00 gage had failed during setup, but the other three gages took data throughout the test. The 9:00 strain gage failed at 67 MPa (9,716 psi), and the remaining two gages (6:00 and 3:00) failed at 74 MPa (10,735 psi), roughly 4/10 of a second before the interior Inconel liner failed at 86 MPa (12,483 psi). Figure 5 shows the failed composite tube. It is apparent that it failed along the 60-degree plies and that the hoop plies unwrapped as part of the failure.

Figure 5: Failed Composite Tube (Source: CCDC AC).
Strain Gage and Pressure Data
The data from the three surviving strain gages and the pressure transducer were analyzed. The strains were corrected for transverse sensitivity, and the principal strains were calculated [11]. The internal pressure can be seen in Figure 6. From the figure, it can be seen that the pressure ramped to about 30 MPa (4.3 ksi), held there for about 15 s, and then rapidly ramped to 86 MPa (12.4 ksi) before final failure. This rapid ramping may have led to premature failure, as it was closer to a dynamic than a static loading. This rapid ramping may be the reason for two failure locations instead of one.
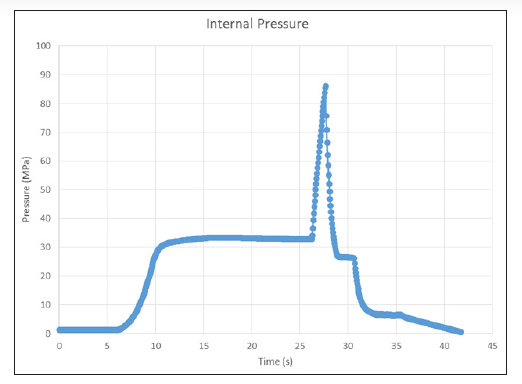
Figure 6: Internal Pressure vs. Time (Source: CCDC AC).
Figures 7–9 show the principal stresses at the three working strain gages. All of the gages failed after the specimen failed. To calculate the maximum principal strains, only data prior to failure were considered. Peak pressure occurred at 27.7 s into the test, so anything after that was considered to be after failure. The time of the maximum principal strain for the 3:00 and 6:00 gages was 27.3 s, with an internal pressure of 74 MPa (10.7 ksi). The 9:00 gage obtained its maximum principal strain slightly earlier at 27.1 s and 67 MPa (9.7 ksi). This most likely corresponded to the first audible noise noticed during the test and would be the initial failure of the composite overwrap. The liner itself then held additional pressure for a short amount of time before failing at 27.7 s. The fact that the 9:00 gage reached its maximum first would imply that failure started near its location, though it could also be the gage coming loose.
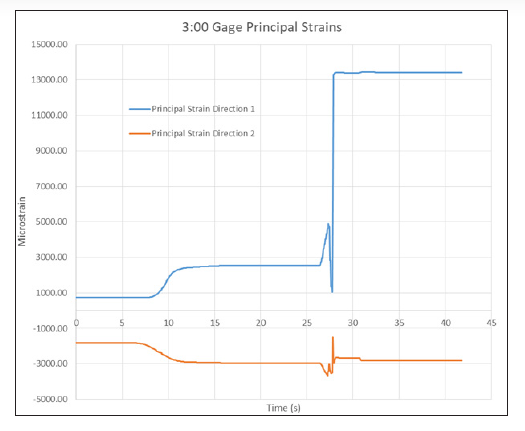
Figure 7: Principal Strains for the 3:00 Gage (Source: CCDC AC).
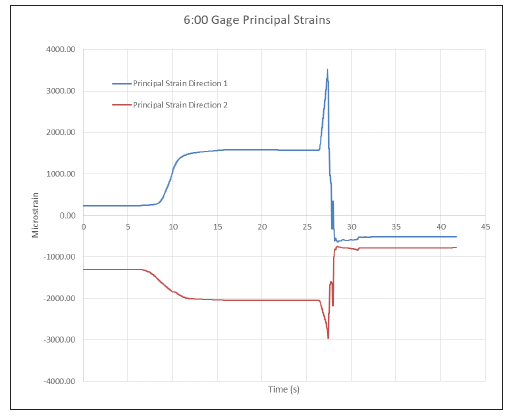
Figure 8: Principal Strains for the 6:00 Gage (Source: CCDC AC).

Figure 9: Principal Strains for the 9:00 Gage (Source: CCDC AC).
Table 1 presents the principal strains for each gage and their angle relative to the axial direction, with pure hoop at 90 degrees. The angles for the maximum principal strains all align with the hoop direction, as would be expected in a cylindrical pressure vessel. Comparing the data in Table 1 to the Helius plot in Figure 4, our measured values are lower in hoop and higher in axial than predicted. We also failed at about 25% lower in pressure than expected. Given that the Helius data were based on data for a different resin, this could account for the differences.
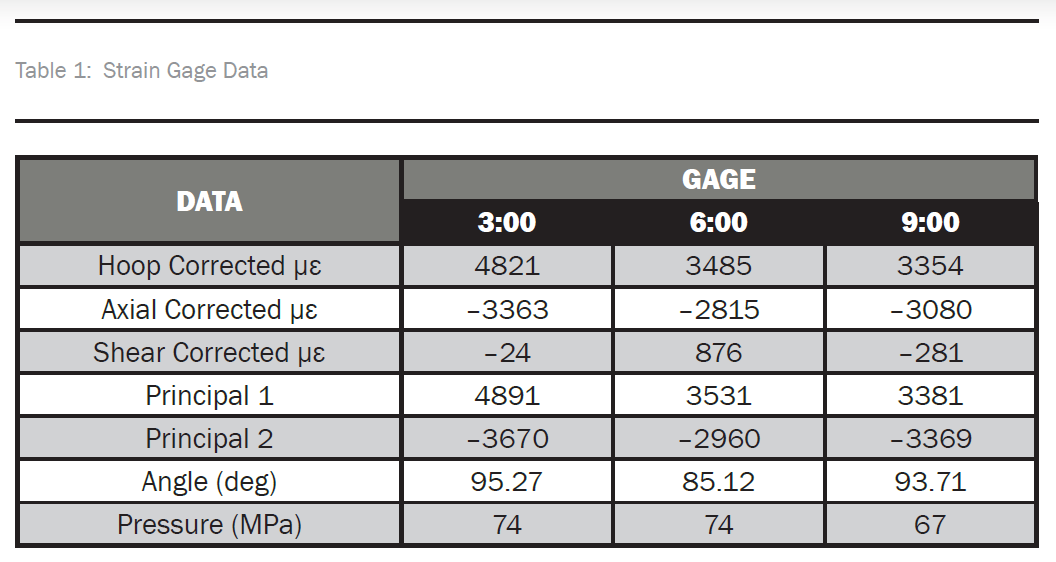
Table 1 shows basically no strain at the 3:00 gage, as expected, but there are significant shear strains at the 6:00- and 9:00-gage locations. As noted, the maximum values occur earlier at the 9:00 gage, implying that it failed first. Figure 6 shows the failed specimen; it is obvious that it failed along the 60-degree plies. The nonzero shear strain could be indicative of the onset of this failure. The lack of this at the 3:00 location is most likely from it being directly opposite the 9:00 gage.
Numerical Modeling
Using standard finite elements to model scenarios where cracking occurs within a part is typically performed by embedding various crack shapes and sizes into predetermined critical regions of the model. As the crack propagates, remeshing is required, which will increase computational time and introduce inaccuracies within the solution. To address this issue, the extended XFEM [2] was developed and demonstrated a significant advantage over other approaches, such as boundary element methods [3] and remeshing [4]. In XFEM, the finite-element space is enriched through the framework of partition of unity with a discontinuous function and near-tip asymptotic functions [5].
In the XFEM framework, the displacement field in the region around a growing crack is redefined to include terms that account for a crack growing through an element and the stress field seen at the crack tip. This modified displacement field is dubbed, enriched, and applied to nodes within a region Ω Enriched, which will evolve with the crack (shown in Figure 10).
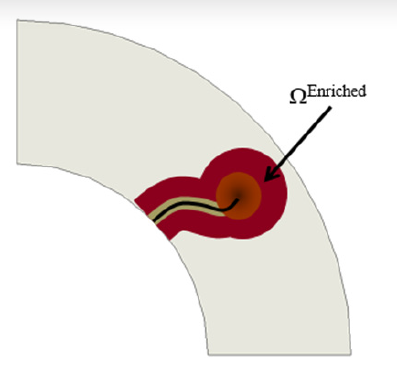
Figure 10: Enriched Region Around Crack (Source: CCDC AC).
The modified displacement field is given in equation (1). The terms u l, a l, and b l represent degrees of freedom at node I. N I is the shape function for node I. In the equation, the green term highlights the contribution that represents the separation of the element caused from the crack. The blue terms represent the stress field produced by the crack tip.
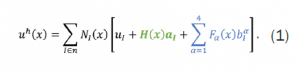
The H term is a Heaviside function, assigning nodes values of ±1, depending on what side of the crack the node falls on. For this analysis, the simulation was performed using the phantom node approach [12]. In this approach (Figure 11), as the crack passes through the element, a set of phantom nodes (nodes not representing real structure) is initially placed on the elements nodes. The phantom nodes are used to define a cohesive link between two elements coexisting on the original element. As the crack propagates and the cohesive breaks, the element separates. Only the real elements are visible.
In Figure 11(a), the initial crack is shown, with red and green representing the real nodes. In Figure 11(b), the simulation sees two elements—one composed of green and black nodes, where the black nodes are phantom nodes, and one composed on red and magenta nodes, where the magenta nodes are phantom nodes. Figure 11(c) shows what is viewed in the output, with only the green and red nodes visible. The cohesive relationship is shown in Figure 12 [12], where T max is the maximum traction at the initialization of the crack through the element. For this simulation, the crack initializes when a critical strain is seen at the centroid of the element. δ max is the maximum opening of the crack before the element fails.
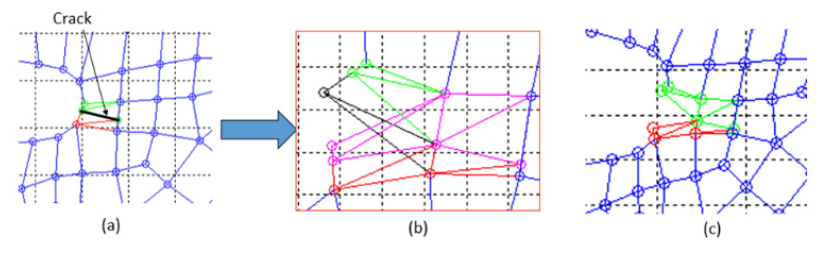
Figure 11: Phantom Node Process (Source: CCDC AC).
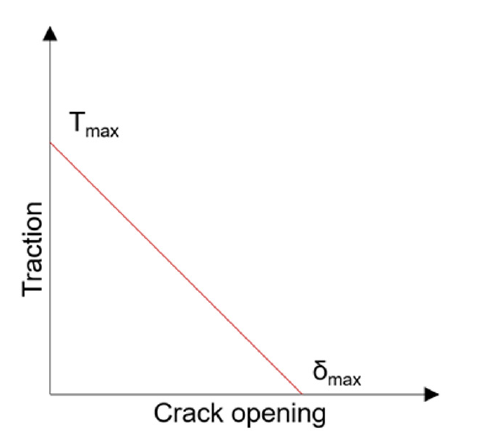
Figure 12: Cohesive Relationship (Source: CCDC AC).
The F functions are four terms representing the asymptotic solution of the crack tip stress field. For the simulation in this article, these terms are not included—only the separation enrichment terms. The crack tip stress field terms will be implemented in future simulations.
Burst Test Simulation
The finite-element simulation was performed using a two-dimensional representation of a quarter cross section of the tube (shown in Figure 13). The simulation was modeled as a static plane strain model using a nonlinear response. The composite was modeled as an orthotropic material using material properties generated from the Autodesk Helius Composite 2017 software. It is assumed there is a rough surface connection between the composite and Inconel. The bottom and left edges of the quarter tube are considered symmetric. The pressure linearly increases on the interior of the tube until failure occurs. To initialize cracking, a critical principal strain on the centroid of the element is set for 3500 με. For the cohesive relationship, the δmax is set to 0.41 mm (0.016 in).
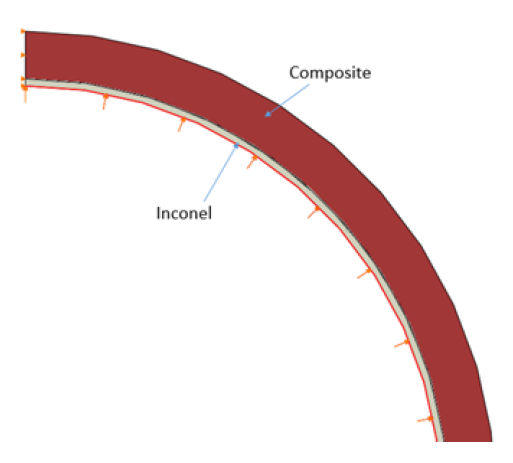
Figure 13: Finite-Element Model (Source: CCDC AC).
As the simulation progresses, cracking begins in the composite at 94.4 MPa (13.7 ksi) (as seen in Figure 14). The crack continues to propagate through the composite until reaching a critical pressure at 100.7 MPa (14.6 ksi), in which case, the simulation fails (as seen in Figure 15). The pressure in simulation corresponds with the pressures in the experiment and the Helius software. The principal strains, seen as the simulation failure on the outer surface of the composite, are 3100 με (shown in Figure 16). This is about 11.4% off from the maximum principal strains seen in Table 1 at the 3 and 9 positions. Given the ideal situation the model represents, this error is within reason. The compressive strain along the axis is not captured, as the model is performed using plane strain.
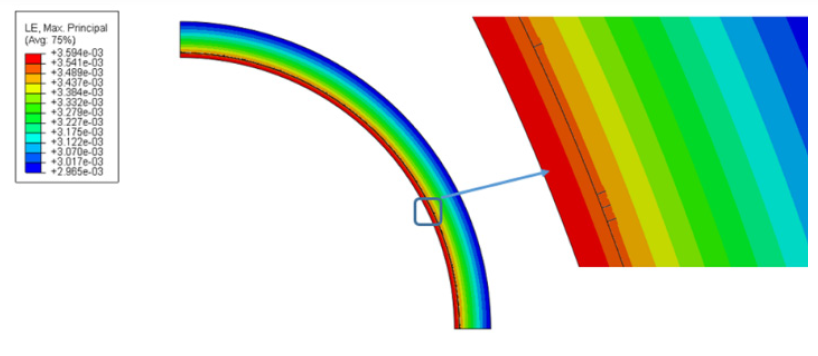
Figure 14: Initial Cracking on Composite (Source: CCDC AC).
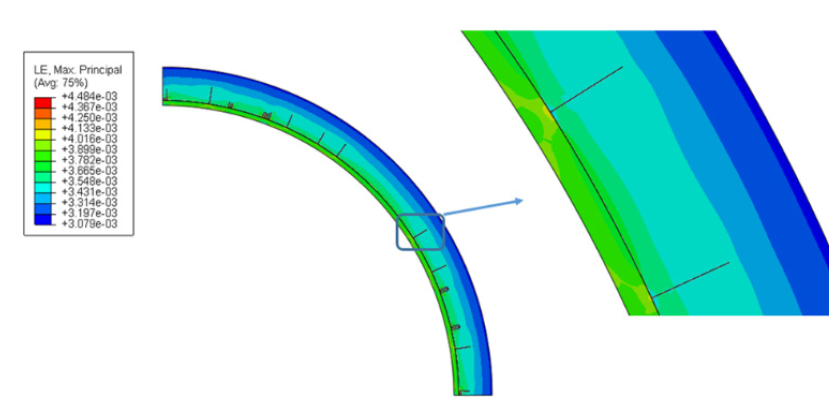
Figure 15: Final Cracking on Composite (Source: CCDC AC).
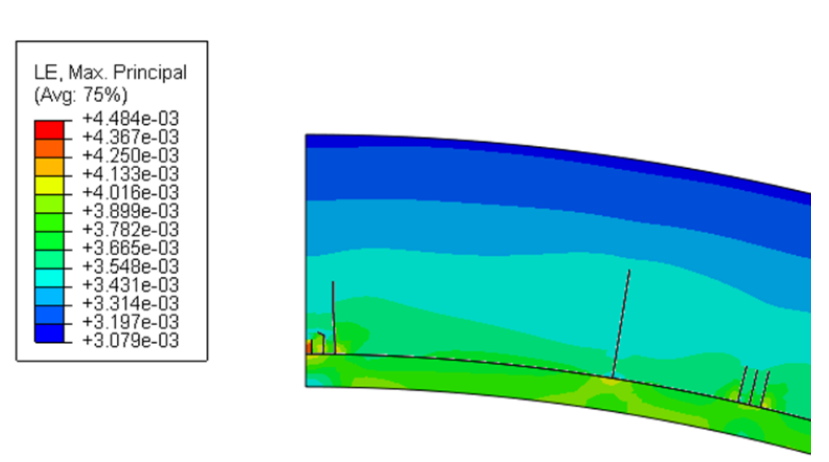
Figure 16: Final Strain Field (ε) (Source: CCDC AC).
Conclusions
A composite tube section was fabricated from an Inconel 718 liner with a high-temperature, carbon-fiber composite overwrap. The tube was then subjected to increasing internal pressure until failure. External strain gages and video were used to monitor the test. An initial basic model based on classical laminated plate theory was developed to predict when failure would occur. The results from this experiment were used to assist in creating and validating a finite-element model of the experiment. The model uses advanced numerical techniques to predict when failure will occur. The results from the initial predictions using Helius, the experimentation, and the finite-element simulation using the extended finite-element method all show critical failure between 83 and 103 MPa.
References
- Macri, M., A. Littlefield, J. Root, and L. Smith. “Modeling Automatic Detection of Critical Regions in Composite Pressure Vessel Subjected to High Pressure.” Proceedings of the ASME 2018 Pressure Vessels and Piping Conference, July 2018.
- Dolbow, J. “An Extended Finite Element Method With Discontinuous Enrichment.” Northwestern University,
1999. - Cruse, T. “Boundary Element Analysis in Computational Fracture Mechanics.” Dordrecht: Kluwer, 1988.
- Carter, B. J., P. A. Wawrzynek, and A. R. Ingraffea. “Automated 3-D Crack Growth Simulation.” Int. J. Num. Meth. Eng., vol. 47, pp. 229–253, 2000.
- Melenk, J. M., and I. Babuska. “The Partition of Unity Finite Element Method: Basic Theory and Applications.” Comput. Methods Appl. Mech. Eng., vol. 139, pp. 289–314, 1996.
- Littlefield, A., and E. Hyland. “120mm Prestressed Carbon Fiber/Thermoplastic Overwrapped Gun Tubes.” Journal of Pressure Vessel Technology, vol. 134, no. 4, https://doi.org/10.1115/1.4007007, August 2012.
- D’Andrea, G., R. L. Cullinan, and P. J. Croteau. “Refractory-Lined Composite Pressure Vessels.” U.S. Army Benet Laboratories Technical Report, ARLCB-TR-78023, 1978.
- Underwood, J. H., and A. P. Parker. “Stress and Fracture Analysis of Ceramic Lined, Composite or Steel Jacketed Pressure Vessels.” Journal of Pressure Vessel Technology, vol. 126, pp. 485-488, https://doi.org/ 10.1115/1.1811109, 2004.
- Mulligan, C., A. Littlefield, and J. Root. “Thermal Barrier Layered Composite Mortar.” U.S. Patent 9939222 B1,10 April 2018.
- Pyromeral Systems S.A. Home page, http://www.pyromeral.com/, accessed January 2019.
- Bucinell, R. “Analysis of a Strain Gage Rosette.” Union College, http://www.engineering.union.edu/ ~curreyj/MER-214_files/Analysis%20of%20a%20Strain%20Gage%20Rosette, accessed March 2019.
- Song, J. H., P. Areias, and T. Belytschko. “A Method for Dynamic Crack and Shear Band Propagation With Phantom Nodes.” Int. J. Num. Meth. Eng., vol. 67, pp. 868–893, 2006.
Biographies
ANDREW LITTLEFIELD is the lead composite engineer at CCDC AC Benét Laboratories, Watervliet, NY, where he works on composite gun tubes and shrouds, electromagnetic railgun launchers, gun barrel vibration absorbers, and simulated proof testing of mortar base plates. Prior to joining CCDC AC, he worked for the U.S. Air Force Research Laboratory on applying composites to spacecraft structures. He received the 2010 Army Science Conference Best Paper Lethality Award and several research and development awards. He has authored several journal and conference papers and technical reports. He has patents for a self-powering prognostic gun tag, an electromagnetic gun launcher, and composite mortar base plate and tube. Dr. Littlefield holds a Ph.D. in mechanical engineering from Rensselaer Polytechnic Institute (RPI).
LUCAS SMITH is the Tube Fatigue Laboratory leader at Benét, where he researches, designs, develops, manufactures, tests, and supports fatigue testing and conducts applied research and development support for all new, modified, and legacy thick-wall pressure vessel assemblies. He has published multiple government reports. He received a patent related to the gun shield of an M60 main battle tank and applied for patents related to his high-pressure work and fatigue-related testing. Mr. Smith holds a B.S. in mechanical engineering from RPI and an M.S. in mechanical engineering from Union Graduate College.
MICHAEL MACRI is a mechanical engineer at Benét, where he leads several research projects in developing advanced numerical algorithms for analysis of artillery systems. He is also the lead instructor for the Armament Graduate School’s finite-element and numerical methods courses. Prior to his work at Benét, he worked for the U.S. Army Research Laboratory as a National Research Council post-doc. His research expertise includes meshless methods, multiscale modeling techniques, numerical fatigue and fracture analysis, and partition of unity enrichment methods, such as XFEM. Dr. Macri holds a Ph.D. in mechanical engineering from RPI.
JOSHUA ROOT is a mechanical engineer at Benét, where he designs, builds, and tests composite gun tubes and associated hardware. His expertise is in working with composite materials and managing complicated systems, designing parts to take advantage of the unique properties of composites, researching nontraditional composite materials, performing various types of analyses on composite materials, testing composite materials at the coupon and part levels, and performing forensic analysis on composite parts that have seen field service. He holds two patents and coauthored the second-place outstanding paper for SAMPE 2004. Mr. Root holds a degree in mechanical engineering from Cedarville University and an M.S. in mechanical engineering from Union Graduate College.