


Introduction
Drones and unmanned aerial vehicles (UAVs), such as those pictured in Figure 1, have been the subject of active development and use by the Department of Defense (DoD) for reconnaissance since at least the mid-1980s. Unfortunately, the need for information on combatant locations and capabilities has often been so urgent, these machines were first employed before full development and testing could be completed. In fact, so successful and useful were they in initial applications (and the demand for them so high), low-level production ensued after just one or two deployments to areas of interest [1]. These reconnaissance systems did not put pilots’ lives at risk, and thus were operable in situations and conditions normally viewed as dangerous or harsh to humans. Not only was this capability a high motivating factor for UAV use within the DoD, it may have been the primary reason that initial transition and acquisition were accelerated before system reliability could be fully investigated and character- ized. In the words of Secretary of Defense William Perry in 1996, “If Predators save one soldier’s life, they are worth deploying now.”
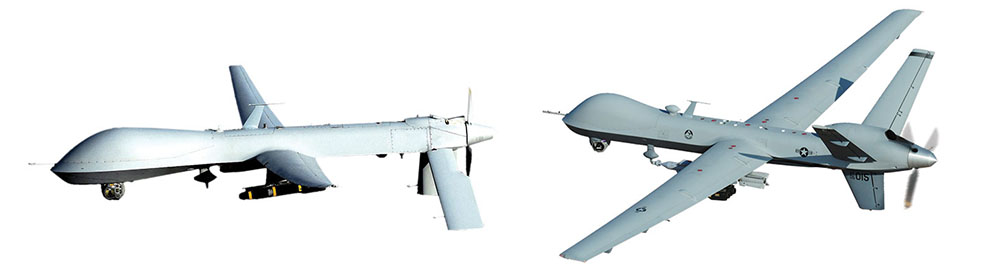
Figure 1: An MQ-1 Predator (Left) and MQ-9 Reaper (Right), Which Provided Intelligence, Surveillance, and Reconnaissance During Operation Iraqi Freedom (OIF) and Operation Enduring Freedom (OEF) (U.S. Air Force Photo/Lt. Col. Leslie Pratt).
Over the past 15 years, drone designs have rapidly proliferated [2]. Early designs resembled traditional aircraft in general shape and size. Today, much smaller morphologies are proliferating on the market, ranging from meter-sized quadcopters down to “birds” and potentially even minute “insects” and “spiders” that can easily rest on a palm. A video demonstration developed by the University of Pennsylvania’s General Robotics, Automation, Sensing, and Perception (GRASP) Laboratory showing current capabilities in tandem aerobatics, three- dimensional (3-D) flight formation, and obstacle circumlocution for a series of 20 “nano” quadroters is available on the Internet [3]. In addition, two recent DSIAC Journal articles surveyed the state-of-the-art in drone fleet coordination [4, 5]. Consider also the photograph of a mosquito-sized drone mock-up model sitting on a person’s fingertip (Figure 2). Though nonfunctional, this prototype indicates what developers are considering for potential next steps and a future avenue this technology will be taking. Of course, with new developments such as these come new challenges as well, particularly in the areas of miniaturization, aerodynamics, quality, reliability, and cost-effective production.
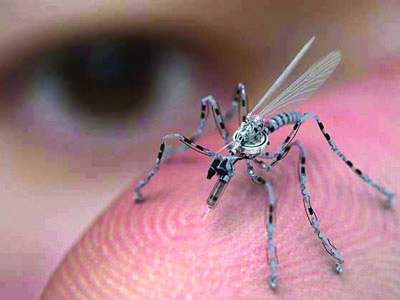
Figure 2: A Mock-Up Prototype of a Drone “Insect” [6].
Thus, it appears that today we are standing on the threshold of a new technological age, where drones have the potential to become commonplace in public life, with smaller models mass-produced rapidly, and likely with a haste that seems to belie any focus on quality and reliability. Whereas public interest in drone use has centered mainly on potential encroachments on individual privacy and the weaponization of this technology, defense development interests have remained focused on reliability and equipment safety.
This article surveys the lengthy reliability evolution of this technology with the objective to pinpoint successful approaches that yield improved initial reliability of emerging technologies. Our specific focus is on what past records, our cumulative body of engineering knowledge, integrated computational materials engineering (ICME), and multiple-stress accelerated life testing (ALT) can do to achieve high reliability (especially when the pace of development and transition to acquisition is as high as current trends suggest it will be).
UAV Failure Patterns
Public interest and support are particularly important because the public opinion tends to influence the Federal Aviation Administration’s inclinations to allow these unmanned vehicles into public airspace. Because public interest is guided by what it sees in the various broadcast media, our investigation started with a drone crash database compiled and maintained by the Washington Post starting in 2007 [7]. The data in this link are provided mainly in summary format. Access to the full, detailed records can be obtained at a website titled UK Drone Wars [8]. Almost 260 records can be found therein, providing details on specific dates, models, locations, country of origin, and in many cases details of the failure modes found to have caused the crash. Many of these documents were obtained from the DoD through the Freedom of Information Act. Using this drone crash database, our initial UAV failure trend analyses are noteworthy, especially when viewed against the backdrop of the DoD’s own summary reports, which are reviewed in following text.
Figure 3 summarizes the records archived in the Washington Post database. The top graphic shows how the crash distributions spread through time for the models involved in most accidents. Seven models are specifically named, and then numerous others involved in only one or two accidents were grouped together in the class “Other Models.” While it may appear from these plots that these unmanned aircraft are prone to accidents, the numbers of incidents are actually within an order of magnitude of those from manned military aircraft.

These graphics are actually more reflective of the use frequency of equipment than the equipment’s inherent reliability. The accident rates are proportional to equipment use rates. For instance, Predator is the most frequently deployed UAV, and it is most frequently flown in Afghanistan, the United States, and Iraq. Predator is also the model with the highest crash record, and these crashes have occurred principally in these same three countries, as the graphics indicate. Though the Washington Post database goes no further back than 2007, we augmented our records with mishap records found in other sources as we encountered them in our investigations. Records for Global Hawk accidents, for instance, were found in defense reports predating 2007, and these records were included when appropriate in the data reflected in Figure 3. Incidentally, the Global Hawk is operated primarily by the U.S. Navy, and public awareness of its mishaps may be obscured by the fact that they occur predominantly over an ocean and thus evidence is quickly lost.
Looking at the data from a different perspective, the crash incidents are split by model types shown in the pie chart in Figure 4. In this graphic, the “Other Models” category in Figure 3 can be seen to be represented by dozens of smaller slices roughly on par with cumulative records for Global Hawk.

Not surprisingly, frequent practice and familiarity increase success rates. As the military flew drones in Iraq, Afghanistan, and elsewhere during the past 15 years, accident rates declined to 5.13 per 100,000 flight hours in fiscal year 2011, as opposed to 62.06 in 2001. Specifically, the Predator’s accident rate fell to 4.86 in 2011, compared with the F-16 Fighting Falcon’s 3.89 rate when that fighter jet was at the same point in its service life [9]. On the other hand, with apparently less time aloft, Global Hawk had an accident rate of 15.16 per 100,000 flight hours, almost three times that of the Cold War-era U-2 spy plane it has been replacing.
Factors for Increased Reliability
In 2003, the Office of the Secretary of Defense (OSD) conducted a review of UAV reliability to assess the state of the technology at that time [10]. This report, which is available on the web, is informative of the development histories, operational tempos, and reliability conditions for several of the models used by the DoD. A second report issued in 2007 (and further discussed in following text) provides additional data on operational tempos as well as investments in the reliabilities of two UAV models [11]. Of particular interest here are the operational tempo data compiled in both of these documents.
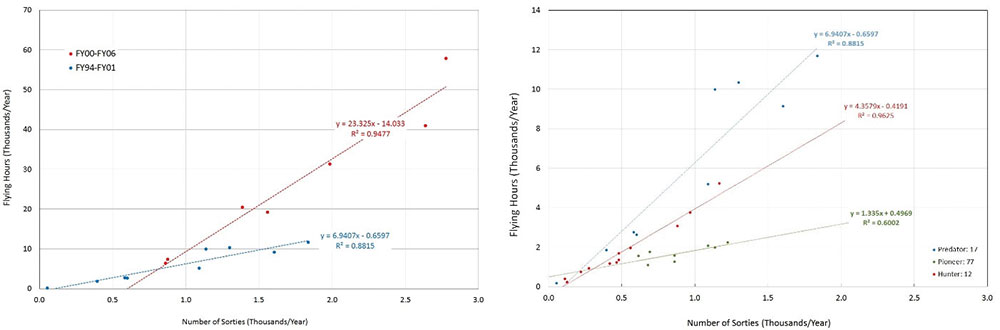
Figure 5 (top) shows data compiled from both reports. The plot represents the length of each flight (sortie) in thousand hours per year on the vertical axis and the increasing number of sorties (also in thousands per year) on the horizontal axis. These data come from earlier and later blocks of time, though there is considerable overlap between the two sets. The operational tempo of the earlier set was governed mainly by flights associated with developmental testing and training. The later block of data represents deployment and increased use of the Predator model in OIF and OEF. Increased slope of the later plot corresponds to longer flights; and data plotted on the right end of the horizontal axis correspond to increasing numbers of sorties per year.
The bottom graphic in Figure 5 shows similar operational tempo data from the mid-1990s through 2001 for Predator, Pioneer, and Hunter. The legend of this later graphic gives the cumulative mishaps that occurred over this timeframe. Without further additional information from investigations following each of the mishaps represented here, the wide scatter in the data makes trend analysis risky at this point, though the plots do indicate Predator often undertakes much longer sorties than the other two models. Background factors such as environmental and battle conditions, failure mode, and prior history are all relevant to appropriately grouping data into sets for comparisons of failure rates. For instance, it would be unfair to group aircraft that were shot down by enemy fire with those that failed due to an engine malfunction.
Returning to the OSD report from 2003, those investigators were able to access records to isolate and group failure modes into categories involving the power plant (power and propulsion), flight control systems, communications, human factors, and a miscellaneous bin. Data (reproduced as pie charts in Figure 6) were provided in the report for two versions of Predator and Pioneer and one version of Hunter. Note that a word of caution about interpreting these graphics is warranted. In both Predator and Pioneer, it would appear that design modifications between RQ-1A and RQ-1B and between RQ-2A and RQ-2B caused reliability issues with the power plants in these two aircraft. However, this appearance/presumption is incorrect, given that these charts are limited to percentage scales. Focus on other system reliability issues, such as flight control and human factors, would reduce failures in these later subsystems and improve overall system performance while shifting upward the relative contribution of power and propulsion to system unreliability, even though the overall performance of aircraft reliability has improved. Compartmentalizing aircraft reliability, as shown in Figure 6, is a useful way to organize and conduct initial reliability assessments and modeling, and it should continue into further subcategories within each of these subsystems as the design gains field experience.

At least two of these UAV platforms were transitioned and acquired by the DoD by way of accelerated development pathways, and continued design and reliability improvements were sustained through much of the lives of the program. The investigation of Long et al. (some of whose data have been reproduced in Figure 7) provides considerable insight regarding potential impacts this approach can have on system reliability. For the Predator and Global Hawk (Block 10) platforms, they assessed increases in mean time between failures (MTBF) over time as a metric for reliability growth and improvement.
![Figure 7: Plots of MTBF for Predator and Global Hawk, Based on the Investigation of Long et al. [11].](/wp-content/uploads/2019/11/figure-7.jpg)
Increasing MTBF is generally associated with increasing reliability, if failures are exponentially distributed—that is, if failures are random and do not impact one another. The plots in Figure 7 show increasing MTBF for both Predator and Global Hawk (Block 10) over substantial portions of the program lives. Interestingly, Long et al. also carefully untangled all of the program costs and were able to determine the dollars devoted just to improvements in reliability over the time represented by the plots. They found that for Global Hawk, system failure rate was reduced by 42% from 2001 to 2006 and life cycle support costs were reduced by 23%. This finding allowed them to calculate a return on reliability dollar investment (RORI) of 5:1. For Predator, the figures were even more impressive. Between 1998 and 2006, improvements in platform reliability reduced failure rates by more than 48% and reduced life cycle support costs by 61%. The RORI in this case was 23:1.
The lesson to be learned here is that when reliability becomes a focus of management, it improves markedly, even for systems developed and transitioned under accelerated circumstances when quality and reliability have to take second place behind other priorities. As summarized in Figure 8, reliability also improves over time as knowledge and experience with the technology are gained both in the production plant and in the field by users. This fact has long been a part of the general body of knowledge [12]. Preliminary models of reliability today often provide optimistic predictions because many nuances associated with field use conditions are missing or are not practically considered in early models. Initial prototypes show demonstrably lower measured reliabilities because they capture unanticipated interactions between components and use conditions, but these are culled with continued development and design optimization. Reliability increases accordingly. Mass production then introduces additional variances associated with scale and materials used in fabrication, but with time, these variances are reduced as quality assurance improves, production experience evolves, and reliability grows.

Also understood only in general terms is how reliability is affected by end-use conditions, which can include mission creep and accelerating operational tempo. These factors are summarized in the graphic of the “bathtub” curve of failure rates over time when the design is subjected to different combinations and intensities of environmental stress factors known to accelerate senescence of material systems (Figure 9). Heat, cold, ultraviolet radiation, rapid thermal cycling, thermal shock, low-frequency and acoustic vibrations, mechanical impacts, environmental pollutants, and other conditions commonly associated with high- performance aircraft and airborne defense systems are known to increase antecedent failure rates and reduce product life accordingly.

These environmental factors, collectively accounted for in models by overly simple factors representing “harsh conditions,” operate individually, tandemly, and synergistically to drive airborne electromechanical systems to fail prematurely. These failures continue to emerge despite industry’s best efforts to eliminate inherent flaws, design vulnerabilities, and defects during design, parts selection, and manufacturing processes. Synergetic effects of these conditions are leading factors affecting failure rates of aerospace components and assemblies.
Conclusions
A perception persists in industry that quality manufacturing is all that is required to assure the reliability of complex electromechanical systems and assemblies. While a consistent high-quality manufacturing is no doubt a necessary prerequisite to product reliability, only a “design for reliability” (DFR) approach can assure that well-manufactured designs maintain high reliability in intended applications. Until this approach becomes part of the fabric of our industrial culture, disparities will continue to be commonly observed between operational reliability and specified reliability requirements that do not adequately account for all potential causes of operational mission failure.
To cost efficiently prioritize, organize, and implement ALT strategies in support of high inherent system reliability objectives, reliability and test engineers need to habitually employ systematic experimental design, as well as analysis tools such as finite element modeling. In addition, these engineers need to include a variety of tandem or mixed accelerated life techniques to stress components and assemblies in conditions that more closely mimic the wide range of field conditions where military equipment is being used. Only failure analyses based on physics of failure and materials science will provide effective diagnoses of failure modes and mechanisms, will identify points of design vulnerability, and will support development of efficient failure mitigation strategies.
Military system developers have become more receptive to strategies using advanced environmental screening methods, such as highly accelerated life testing (HALT) and highly accelerated stress screening (HASS) [13]. Testing systems to withstand preproduction thermal ramping and random vibration, collectively referred to as HALT, is becoming considered critical to the development process, as is testing the ability to withstand post-production (HASS). Two principal technology standards available for the performance of these frequently required procedures include 6-degree of freedom (6DoF) and NAVMAT. Significant differences in the basic characteristics of these two approaches can result in different accumulated fatigue damage, and hence different abilities to precipitate failures originated from design and manufacturing defects.
Emerging new electromechanical technologies provide increasing challenges with respect to assuring the quality and reliability of components and assemblies, particularly associated with component and assembly miniaturization, and with increasing demands in these products and materials for higher performance, lower cost, less space and weight, and more compactness. Perhaps the most efficient path to rapid realization of new or emerging technologies will take advantage of new capabilities in integrated computational engineering design (that incorporate finely tuned but generic stress and aging functions) together with novel material combinations (having properties and established failure modes suitable for military applications derived from an integrated database that comprises our body of knowledge augmented search and learning algorithms).
In addition, investment and development in ICME need to be performed. The value of using (ICME) design tools will reduce the program development costs of new UAVs by improving the inherent reliability when the vehicle is subjected to new manufacturing processes, advanced material systems, and extreme environment use conditions. The principal reason for investing in an ICME approach is to capitalize on the continuing integration of verified and validated computational tools and methodologies into contemporary design and manufacturing processes that address common causes of failures by facilitating the design and manufacturing of UAVs with greater durability and reliability. By coupling advanced characterization and experimental techniques with a data exchange system and computational modeling, lengthy and expensive research and development cycles can be replaced by mathematical models with the requisite computational and predictive performance capabilities.
References:
- sUASNews.com. “RPAs Reach 2 million hours.” Published 25 October 2013 (archived at the Wayback Machine, http://archive.org/web/web.php), accessed December 2016.
- Paumgarten, Nick. “Here’s Looking at You, Should We Worry About the Rise of the Drone?” The New Yorker, 14 May 2012, www.newyorker.com/magazine/2012/05/14/heres-looking-at-you, accessed 13 December 2016.
- Network World. “The Future of Drone Surveillance: Swarms of Cyborg Insect Drones.” Published 18 June 2012, www.networkworld.com/article/2222611/microsoft-subnet/the-future-of-drone-surveillance–swarms-of-cyborg-insect-drones.html, accessed 12 December 2016.
- Coy, Mark. “A Modeling Framework for Coaxial-Rotor UAV System Swarms: Performance Analysis via System ID and Cognitive Physicomimetics Techniques.” DSIAC Journal, vol. 3, no. 4, fall 2016.
- Darrah, Marjorie, Eric Sorton, Mitch Wathen, and Marcela Mera Trujillo. “Real-Time Tasking and Retasking of Multiple Coordinated UAVs.” DSIAC Journal, vol. 3, no. 4, fall 2016.
- RT News. “US Military Surveillance Future: Drones Now Come In Swarms?” Published 20 June 2012, http://on.rt.com/aowt–kg, accessed December 2016.
- Whitlock, Craig. “When Drones Fall From the Sky.” Washington Post, published 20 June 2014, http://www.washingtonpost.com/sf/investigative/2014/06/20/when-drones-fall-from-the-sky/, accessed 12 December 2016.
- Drone Wars UK. “Drone Crash Database.” https://dronewars.net/drone-crash-database/, accessed 12 December 2016.
- McGarry, Brendan. “Drones Most Accident-Prone U.S. Air Force Craft: BGOV Barometer.” sUAS News, published 19 June 2012, https://www.suasnews.com/2012/06/drones-most-accident-prone-u-s-air-force-craft-bgov-barometer/, accessed December 2016.
- Office of the Secretary of Defense. “Unmanned Aerial Vehicle Reliability Study.” Published February 2003, http://www.uadrones.net/military/research/acrobat/0302.pdf, accessed 1 December 2016.
- Long, E. Andrew, James Forbes, Jing Hees, and Virginia Stouffer. “Empirical Relationships Between Reliability Investments and Life-Cycle Support Costs.” LMI Government Consulting, Report SA701T1, June 2007; http://www.dote.osd.mil/pub/reports/SA701T1_Final%20Report.pdf, accessed 6 December 2016.
- Anderson, R.T. “Reliability Design Handbook.” Reliability Analysis Center Publication No. 376, fourth printing, March 1976.
- Henderson, George, and William Burgess. “Comparing NAVMAT Versus 6DOF for HALT/HASS Testing.” COTS Journal, vol. 11, no. 6, published June 2009, http://files.rtcgroup.com/archives/cots/cots0906.pdf, accessed December 2016.